Working with Cesium
Geospatial Visualization With Clay and CesiumJS
This is a short port of a more sophisticated cljs application that leverages CesiumJS for geospatial visualization, animation, and various interactive 3d projections. After seeing other civitas posts, I decided to try to port over a subset of the functionality in a “lightweight” package, combined with some analysis of open data (in this case, fires in Oregon), and then build up an interactive view/animation of the result.
Clay affords a nice platform for doing this, and scittle can be bent to our will to allow fairly sophisticated cljs/js stuff to be used directly (0 install). We will discuss alternate methods of accomplishing this later in a more efficient manner, but as an experimentation with clay and scittle and cesium, it’s not bad!
(ns cesium.geovis
  (:require [scicloj.kindly.v4.kind :as kind]
            [tablecloth.api :as tc]
            [charred.api :as charred]
            [clojure.java.io :as jio]))
Fire Data
Our working dataset comes from historical Oregon fire data. The original can be found at https://catalog.data.gov/dataset/odf-fire-occurrence-data-2000-2022 I have taken the liberty of gzipping the original csv to make it easier to host.
(def flds
  [:FireName  :Size_class :EstTotalAcres  :Ign_DateTime
   :ReportDateTime :Discover_DateTime :Control_DateTime :Lat_DD :Long_DD
:CauseBy])(def fire-data
(-> (tc/dataset "src/cesium/ODF_Fire_Occurrence_Data_2000-2022.csv.gz" {:key-fn keyword})
(tc/select-columns flds)
(tc/select-rows (fn [{:keys [Discover_DateTime Control_DateTime]}]
(and Discover_DateTime Control_DateTime)))))Here’s a a feel for the structure based on the first 10 records.
(tc/head fire-data 10)src/cesium/ODF_Fire_Occurrence_Data_2000-2022.csv.gz [10 10]:
| :FireName | :Size_class | :EstTotalAcres | :Ign_DateTime | :ReportDateTime | :Discover_DateTime | :Control_DateTime | :Lat_DD | :Long_DD | :CauseBy |
|---|---|---|---|---|---|---|---|---|---|
| Bass 497 | B | 3.20 | 09/02/2015 05:00:00 PM | 09/02/2015 05:05:00 PM | 09/02/2015 05:00:00 PM | 09/02/2015 11:00:00 PM | 42.13361 | -122.04083 | Other-Public |
| Slick Ear #2 | B | 0.75 | 07/18/2000 07:00:00 PM | 07/19/2000 01:20:00 PM | 07/19/2000 01:15:00 PM | 07/20/2000 12:50:00 AM | 44.91519 | -119.28863 | Lightning |
| Woodley | C | 80.00 | 08/24/2000 05:30:00 AM | 08/24/2000 01:07:00 PM | 08/24/2000 01:07:00 PM | 09/01/2000 09:30:00 PM | 45.08509 | -118.33440 | Lightning |
| QUEENS BRANCH | A | 0.10 | 08/10/2001 05:40:00 PM | 08/10/2001 05:47:00 PM | 08/10/2001 05:45:00 PM | 08/10/2001 06:30:00 PM | 42.53671 | -123.21215 | Motorist |
| Chilcoot | A | 0.01 | 08/12/2014 06:15:00 PM | 08/13/2014 04:01:00 PM | 08/13/2014 04:00:00 PM | 08/14/2014 06:30:00 PM | 43.45583 | -122.74889 | Lightning |
| WREN | A | 0.01 | 07/06/2002 01:01:00 PM | 07/06/2002 01:04:00 PM | 07/06/2002 01:02:00 PM | 07/06/2002 01:07:00 PM | 44.58709 | -123.42779 | Motorist |
| Ritner Creek | A | 0.01 | 08/22/2003 04:00:00 AM | 08/22/2003 05:00:00 AM | 08/22/2003 05:00:00 AM | 08/22/2003 09:30:00 AM | 44.74026 | -123.49811 | Lightning |
| Big Tamarack | A | 0.01 | 08/22/2003 06:00:00 PM | 08/23/2003 09:24:00 AM | 08/23/2003 09:24:00 AM | 08/23/2003 12:40:00 PM | 45.63942 | -117.40483 | Lightning |
| COIDC 918 | A | 0.00 | 08/30/2003 02:20:00 PM | 08/30/2003 02:37:00 PM | 08/30/2003 02:30:00 PM | 08/30/2003 02:41:00 PM | 43.52418 | -121.95545 | Other-Public |
| RAYMOND ROAD | A | 0.01 | 09/18/2005 03:00:00 PM | 09/18/2005 03:20:00 PM | 09/18/2005 03:05:00 PM | 09/18/2005 04:30:00 PM | 46.07650 | -123.70566 | Public Utility |
The way we’re going to expose this to sci, for efficiency, is to serialize our fire data as json, then load it via a script tag.
I have processing methods for loading from the local file system and the original application does so and then does ETL from cljs over either csv files, or we compile stuff in cljs as EDN defined in data namespaces.
Since we’re using scittle, I don’t want to break the bank on pushing ETL into the interpreter. Clay allows us to preprocess the data and bake it here for consumption, so we’ll do that.
We can use the ambiently available (and fast) charred to spit our stuff to JSON…
(defn extract-fires [d]
  (->> d
       (tech.v3.dataset/mapseq-reader)
       vec
       (charred/write-json-str )
       (str "FireData = ")
       (spit "src/cesium/firedata.js")))
We only need this is our firedata isn’t already emitted…
(when-not
    (.exists (jio/file "src/cesium/firedata.js"))
(extract-fires fire-data))nilCesium wants date/time in a Julian format, but we have conversion paths for js Date types established. So we’ll leave the start/stop times of our fires as strings and coerce them to Date types directly from cljs. when we read this in on the cljs side, we’ll get json objects for each fire event.
In order to use all our stuff, we’ll need a bunch of dependencies… How can we load them in clay though and have them available for our in-browser cljs environment? Script tags of course!
We can abuse hiccup with script tags and just pull in js files as we would with HTML. As demonstrated elsewhere, we can do the same with cljs files (local to this notebook/the page) if we have scittle as a script.
So our scheme is this: define some hidden hiccup that defines a div that loads all of our dependencies.
Then we can build out the browser portion of our app by leveraging cljs tooling (e.g. reagent) via scittle.
Note: the app portion can be as sophisticated and spread out as we’d like it to be. We can have multiple files (e.g. namespaces) and just load them as script tags, and require them from cljs in scittle as normal.
^:kindly/hide-code
(kind/hiccup
 [:div
  [:script {:src "https://cdn.jsdelivr.net/npm/scittle@0.7.23/dist/scittle.js"
                 :type "application/javascript"}]
  [:script {:src "https://cdn.jsdelivr.net/npm/scittle@0.7.23/dist/scittle.promesa.js"
            :type "application/javascript"}]
  [:script {:crossorigin true
            :src "https://cdn.jsdelivr.net/npm/react@18/umd/react.production.min.js"}]
  [:script {:crossorigin true
            :src "https://cdn.jsdelivr.net/npm/react-dom@18/umd/react-dom.production.min.js"}]
  [:script {:src "https://cdn.jsdelivr.net/npm/scittle@0.7.23/dist/scittle.reagent.js"
            :type "application/javascript"}]
  [:script {:src "https://cesium.com/downloads/CesiumJS/releases/1.132/Build/Cesium/Cesium.js"
            :type "application/javascript"}]
  [:link {:href "https://cesium.com/downloads/CesiumJS/releases/1.132/Build/Cesium/Widgets/widgets.css"
          :rel "stylesheet" }]
  ;;color patch
  [:script {:src "color.js"
            :type "application/javascript"}]
  ;;safe stringify for debugging...
  [:script {:src "safestring.js"
            :type "application/javascript"}]
  ;;data
  [:script {:src "firedata.js" ;;creates FireData var.
            :type "application/javascript"}]
  ;;app deps.
  [:script {:src "protocols.cljs"
            :type "application/x-scittle"}]

  [:script {:src "time.cljs"
            :type "application/x-scittle"}]
  [:script {:src "util.cljs"
            :type "application/x-scittle"}]
  [:script {:src "czml.cljs"
            :type "application/x-scittle"}]
  [:script {:src "etl.cljs"
            :type "application/x-scittle"}]
  [:script {:src "cesium.cljs"
            :type "application/x-scittle"}]
  [:script {:src "widget.cljs"
            :type "application/x-scittle"}]
  ])
Our CesiumJS app’s entry point is another hiccup div exposing an app id with the “core.cljs” script being loaded from scittle
^:kindly/hide-code
(kind/hiccup
 [:div#app
  [:script {:type "application/x-scittle"
            :src "core.cljs"}]])
The App
The application is a typical CesiumJS widget with some reagent ui bits. We have the primary geospatial view, which default to an interactive globe with the ability to spin, zoom, pan, and tilt the view with the mouse or a touchscreen.
Cesium is meant to show animated 3d visuals on top of geospatial layers and projections, so it prominently features a timeline on the bottom. This is an interactive ui that allows the user to move forward and backward into arbitrary points in time, with any temporal data in the visual updating accordingly.
Additionally, the timeline has a control mechanism in the bottom left clock, which allows time to progress forward or backward at a constant rate, to change the rate of change, or to pause the passage of time.
Interactive Globe Renders Below
Additional UI
As a bonus, I tossed in a few buttons below the main view to simplify the interface. We can load all 23K of our fire data (spanning 2000-2022), if we click “Load Fires!”.
After a second or two the fire events will be loaded and we’ll notice the timeline has changed with a new start time somewhere in the year 2000.
A Note on Map Tiles and Base Layers
Cesium is built to work with all sorts of geospatial layers, which are the visual projections of the geography that we want see rendered. We build maps by adding layers (from various sources) and then we can place interactive 3d geometry in the context of these layers.
Most layers come in the form of “map tiles”, which are 3d coordinates mapping a visible chunk of the earth at a particular altitude. So when we zoom into a particular view of the current projection of the earth, the visible tiles are loaded on the fly. This means we either need a tile server or our own local tiles (like a specially oriented directory structure) to serve up typical map layers.
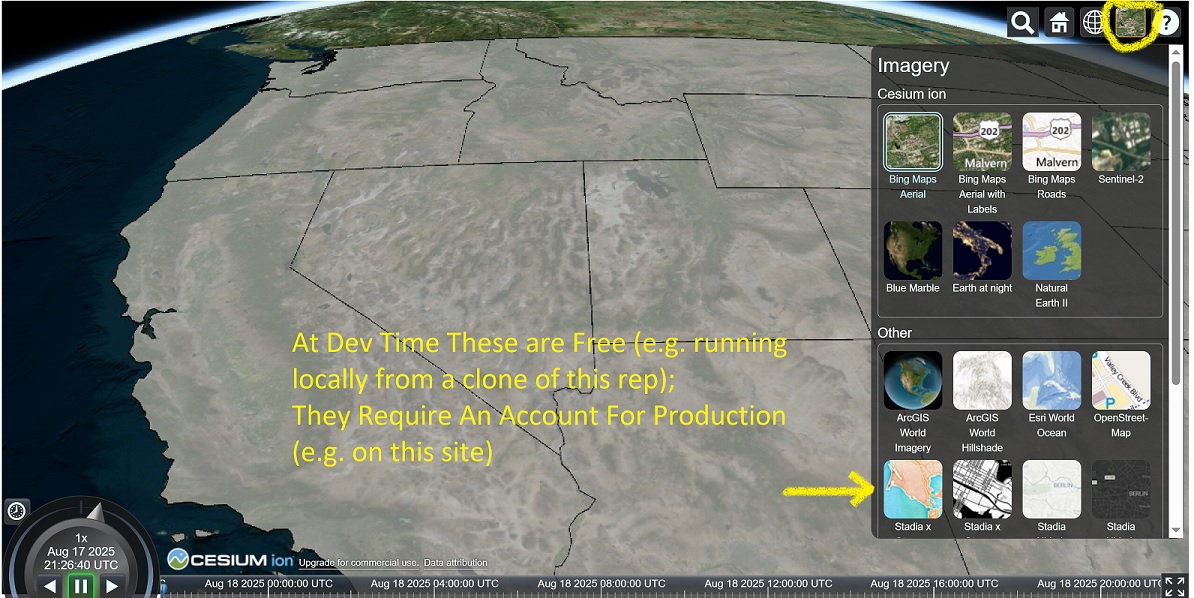
Cesium refers to the underlying layer as the base layer. They provide access to several online map tile providers by way of their “layer picker” interface. This means you can switch the underlyin visual layers at any point if you want to see different features (e.g. topology vs roads vs political boundaries vs 3D terrain…)
Some of the layers Cesium provides appear to be available to you during development time, but if you publish something e.g. on clojure civitas or another domain, you might find that the tile server refuses to send tiles and the visual view is just a default blue tileset (e.g. nothing).
Stadia Tiles Work In Dev But Not Production (Intended)
Missing tiles occurs more commonly with the (very nice) series of Stadia tilesets. To add to the confusion, they are explicitly designed to work if you are working on a local development environment, e.g. if you cloned the clojure civitas repository and loaded this example locally instead of going through the clojure civitas github pages site, all of the Stadia tiles will work flawlessly. This is due to the circa 2023 move toward a funded tile hosting service, per https://github.com/CesiumGS/cesium/pull/11485 Since then, Stadia now hosts all the Stamen maptiles, and has terms of service per https://docs.stadiamaps.com/authentication/#authentication . In the case of local development, they allow requests from localhost, but will require an api or an authenticated domain, which requires registering with their service.
At the time of publication, I missed this change, and so we have a change in tileset and presentation to account.
Back to the App
GeoJSON For Complex Polygonal Layers (State Boundaries)
Since not every layer has state boundaries baked in, I added a layer from open source state boundaries via GeoJSON. We get the added benefit of having states recognized as named entities in Cesium, so clicking on a state boundary will pop up some information about the entity (in this case, the name).
This layer can be toggled using the “Toggle States” button. With some base layers, it may look better to have it toggled off since the current translucent grey polygon fill may collide with interesting visual features.
Side Note - Clay Local Files vs. Quarto
Normally, we can just reference files that are local to our notebook’s folder, like images and script tags, and Clay will pick them up just fine. When we go to publish on the Quarto web site, Clay will emit a baked document in .qmd format, wherein only the references to assets in use will be picked up and copied over as static assets.
As a consequence of how this Quarto site builds stuff, if we want to have our topojson file available for our CesiumJS app to pull locally, we have to reference it somewhere to indicate it should be copied to the static site (or we stick it in a global resources file etc.).
This work-around applies to any resource we want to have inside a webapp like geojson or other data, since Quarto isn’t going to know that. We can communicate our need by adding some reference to the doc, like a download link using the hiccup below.
(kind/hiccup
 [:a {:href "ne_10m_us_states.topojson"
      :download "ne_10m_us_states.topojson"}
"ne_10m_us_states.topojson"])Geospatial Entities
This is a common idiom in CesiumJS. There is a natural correspondence between geospatial entities and interactive analysis. Cesium enables workflows for interactive selection and viewing; we can tap into these flows with cljs and make even more interesting stuff.
UI
At this point, we can play around with the UI a bit to see what cesium offers out of the box. Feel free to play with any of the layers in Layer Picker control in the upper right corner.
It might be nice to have some additional information like cities and streets. We can click on the layer picker in upper right, and pick the ‘Bing Aerial Maps With Labels’ layer, or any of the other road maps.
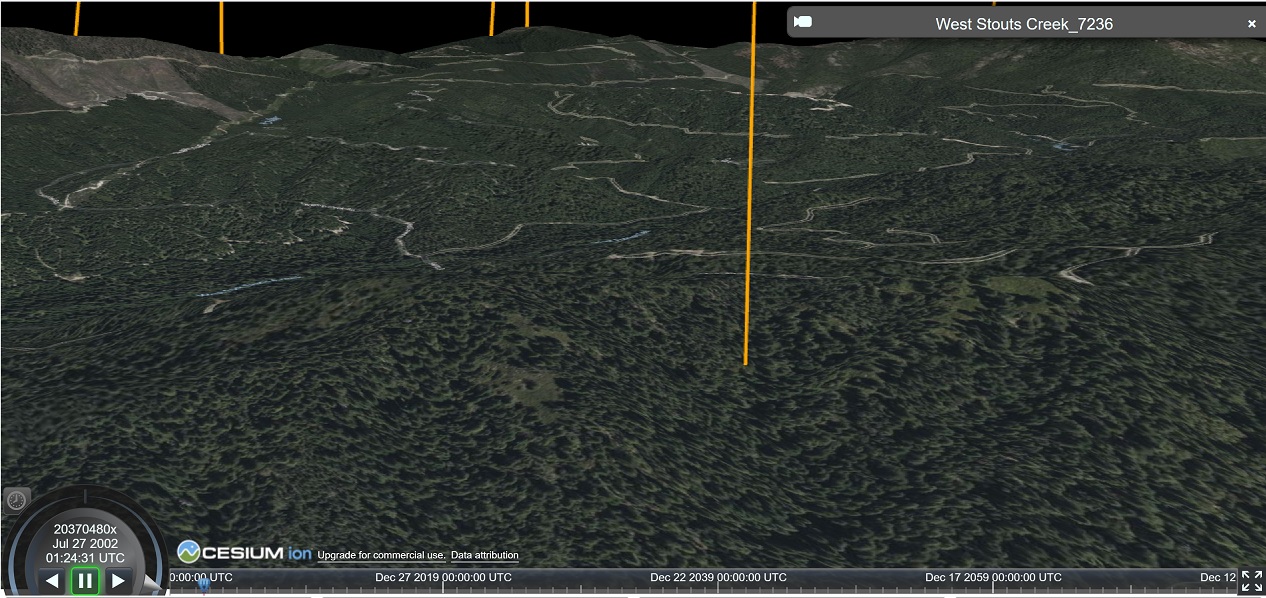
Once that’s done, we’ll zoom in to Oregon in the northwest corner of the US. This is where our data lives, so our fires will show up animating around here as simple arcs popping up from the earth over time, corresponding to the presence of a fire.
If we hit play at this point, we might find a view that looks like this:
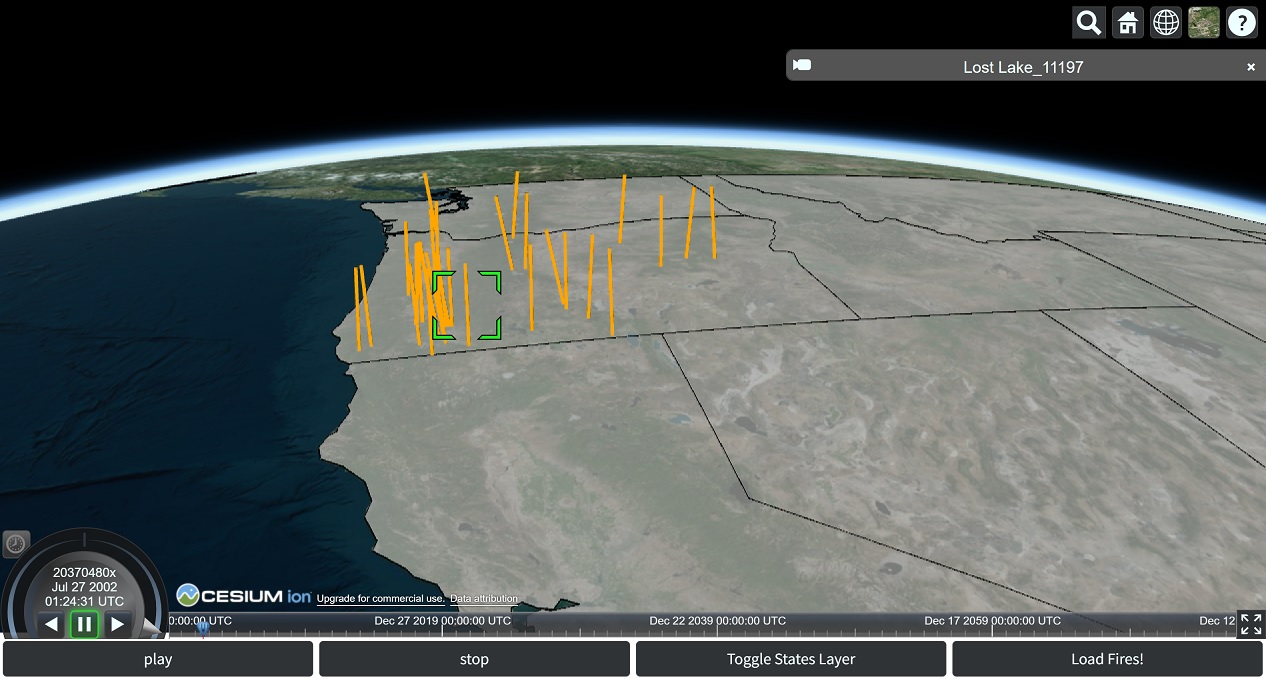
We can pause the view using either the Stop button or the Cesium UI button in the bottom left Clock widget. Since fires are also entities, we can click on one and get some information.
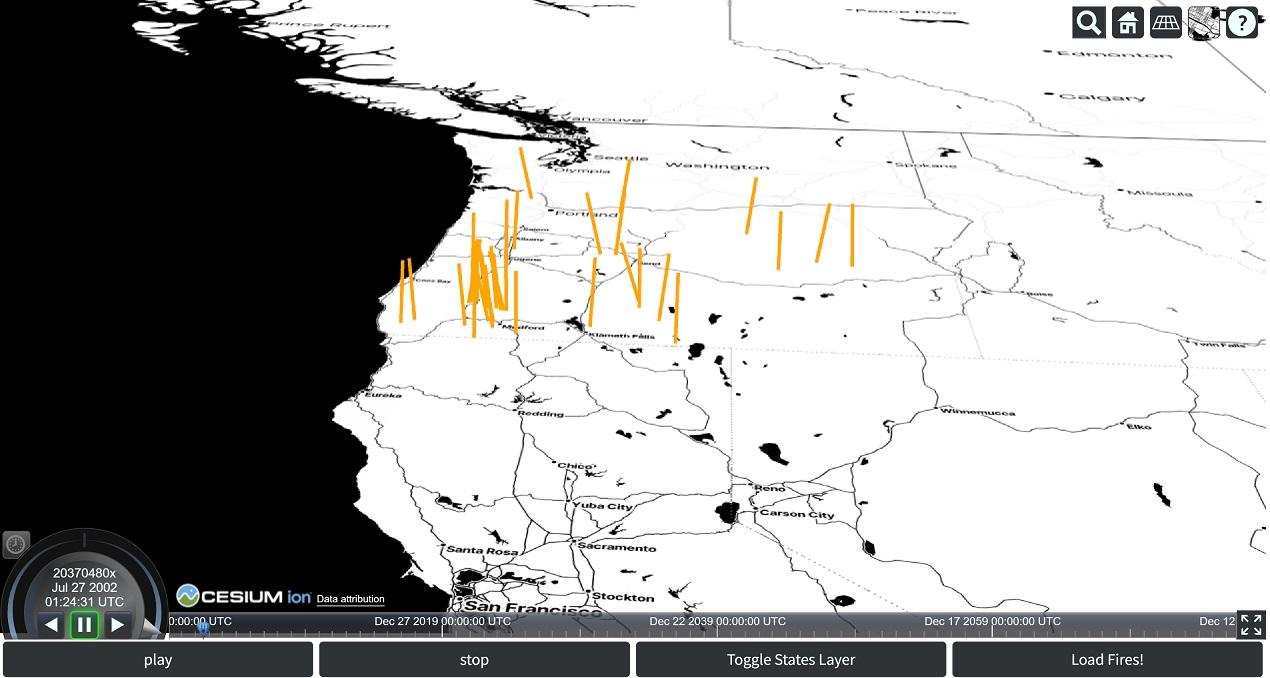
If you are running locally (or in the future, if I pony up for an API key from Stadia) then you can get a view of their Stamen Toner map like this one:
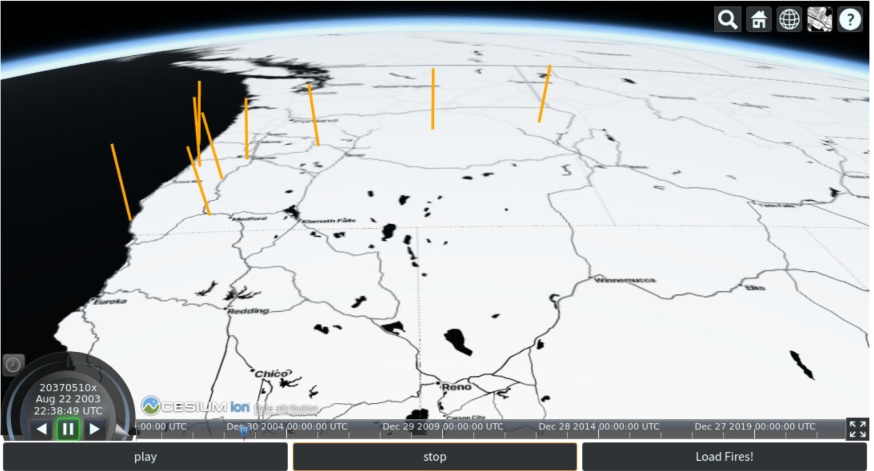
We change projections with the upper right corner UI control. Clicking on the wireframe globe lets us choose either a 2d planar overhead projection, or a 2.5 Columbus view. Let’s use that.
For reference if we had access to the Stamen Toner layer, this is one more view:
3D Tiles
One of the biggest features is Cesium’s Ion streaming 3d tile service. We can demo it and turn our flat globe surface into detailed textured terrain.
The hillshade layer shows off more of the terrain:
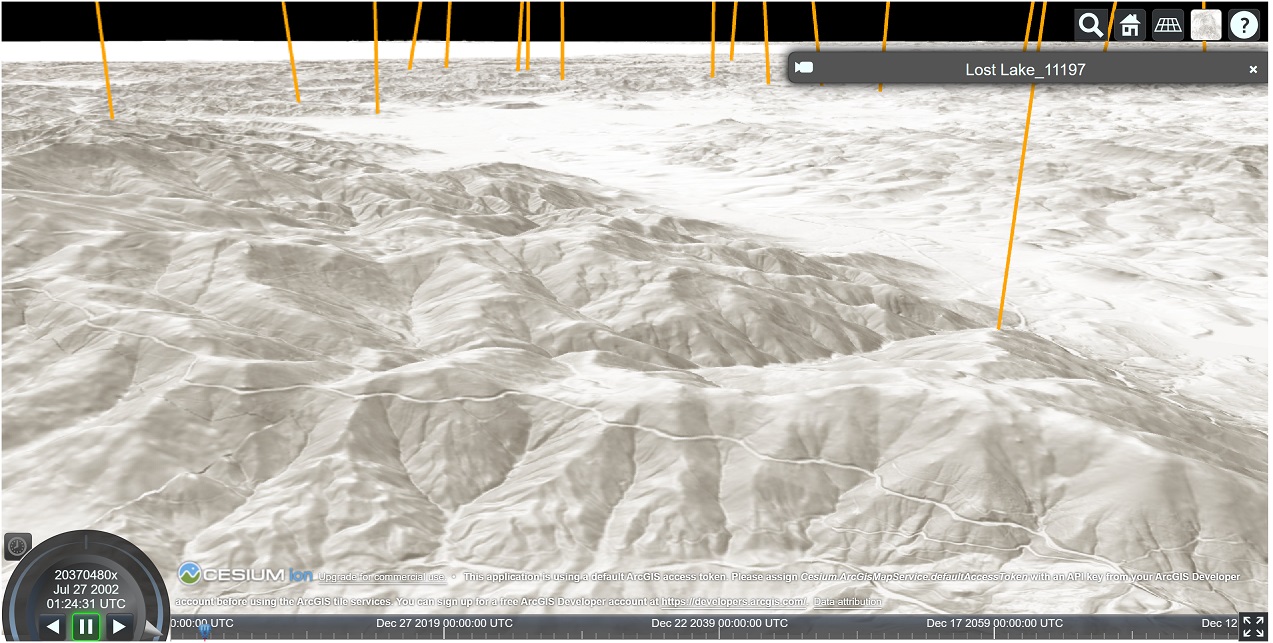
Stay tuned for more 3d stuff.
Outro
This is a brief little demonstration of integrating cesium with clay and doing some very basic analysis. In the original application, I had much more sophisticated happenings, like tying together realtime analytics with the visualization (e.g. interactive vega plots).
I have intentionally elided some of the interop requirements for interfacing with cesium and its entity model, geospatial api, timeline, CZML, various uis, etc. The source files in this repo provide some documentation for the intrepid, but I will explore some of these concepts in future posts. CesiumJS has a ton of features, and it’s a bit of a shame the clojure world doesn’t leverage it more.
source: src/cesium/geovis.clj